ਤਸਵੀਰ:Gamma plot.svg
ਨੈਵੀਗੇਸ਼ਨ 'ਤੇ ਜਾਓ
ਸਰਚ ਤੇ ਜਾਓ

Size of this PNG preview of this SVG file: 600 × 480 ਪਿਕਸਲ. ਹੋਰ ਰੈਜ਼ੋਲਿਊਸ਼ਨਜ਼: 300 × 240 ਪਿਕਸਲ | 960 × 768 ਪਿਕਸਲ | 1,280 × 1,024 ਪਿਕਸਲ | 2,560 × 2,048 ਪਿਕਸਲ.
ਅਸਲ ਫ਼ਾਈਲ (SVG ਫ਼ਾਈਲ, ਆਮ ਤੌਰ ’ਤੇ 600 × 480 ਪਿਕਸਲ, ਫ਼ਾਈਲ ਦਾ ਅਕਾਰ: 13 KB)
ਸਾਰ
| ਵੇਰਵਾ |
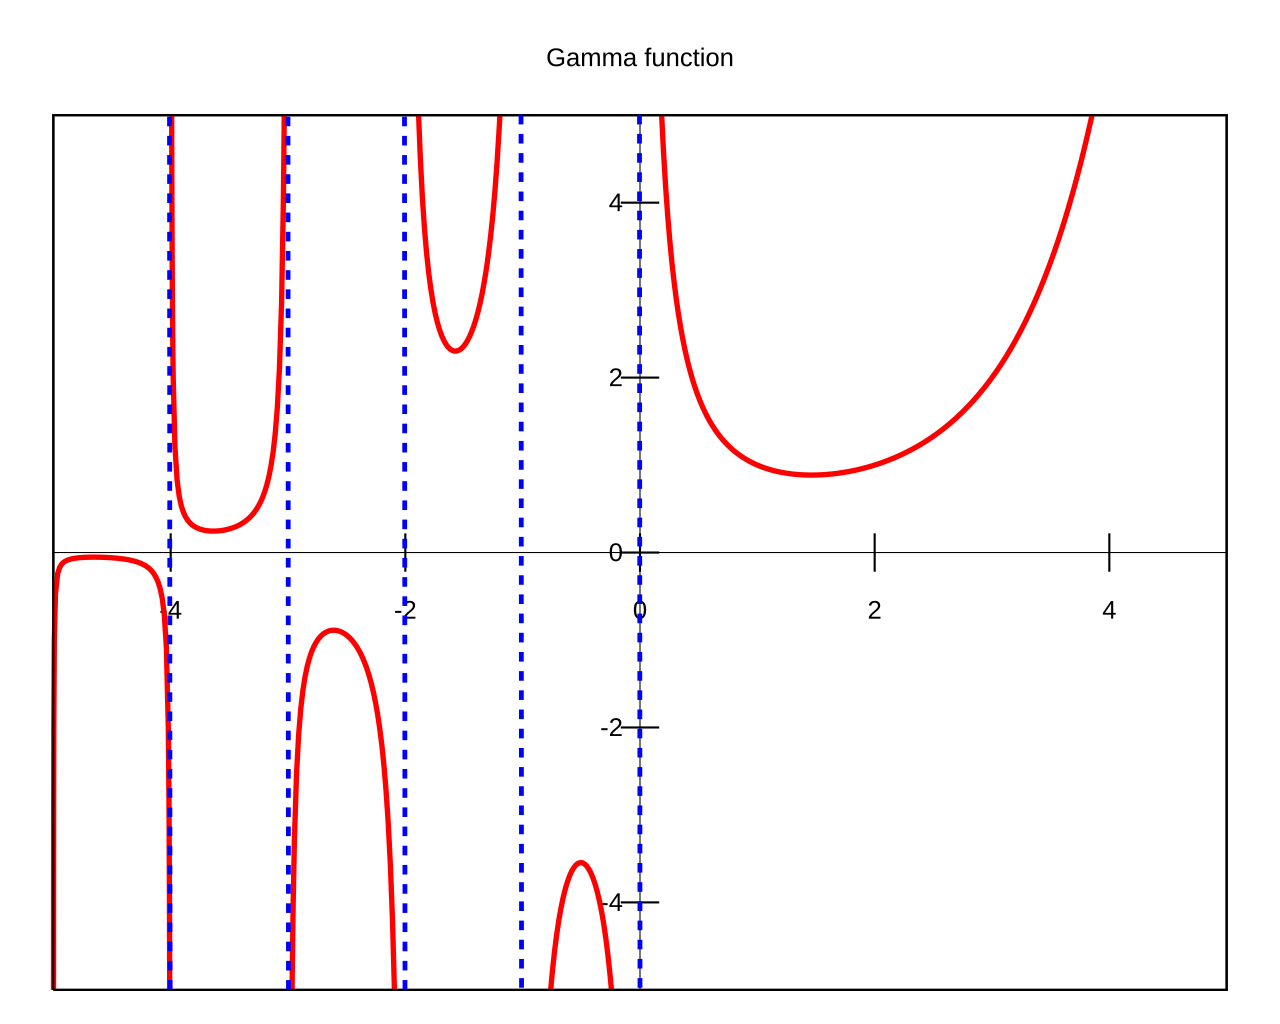
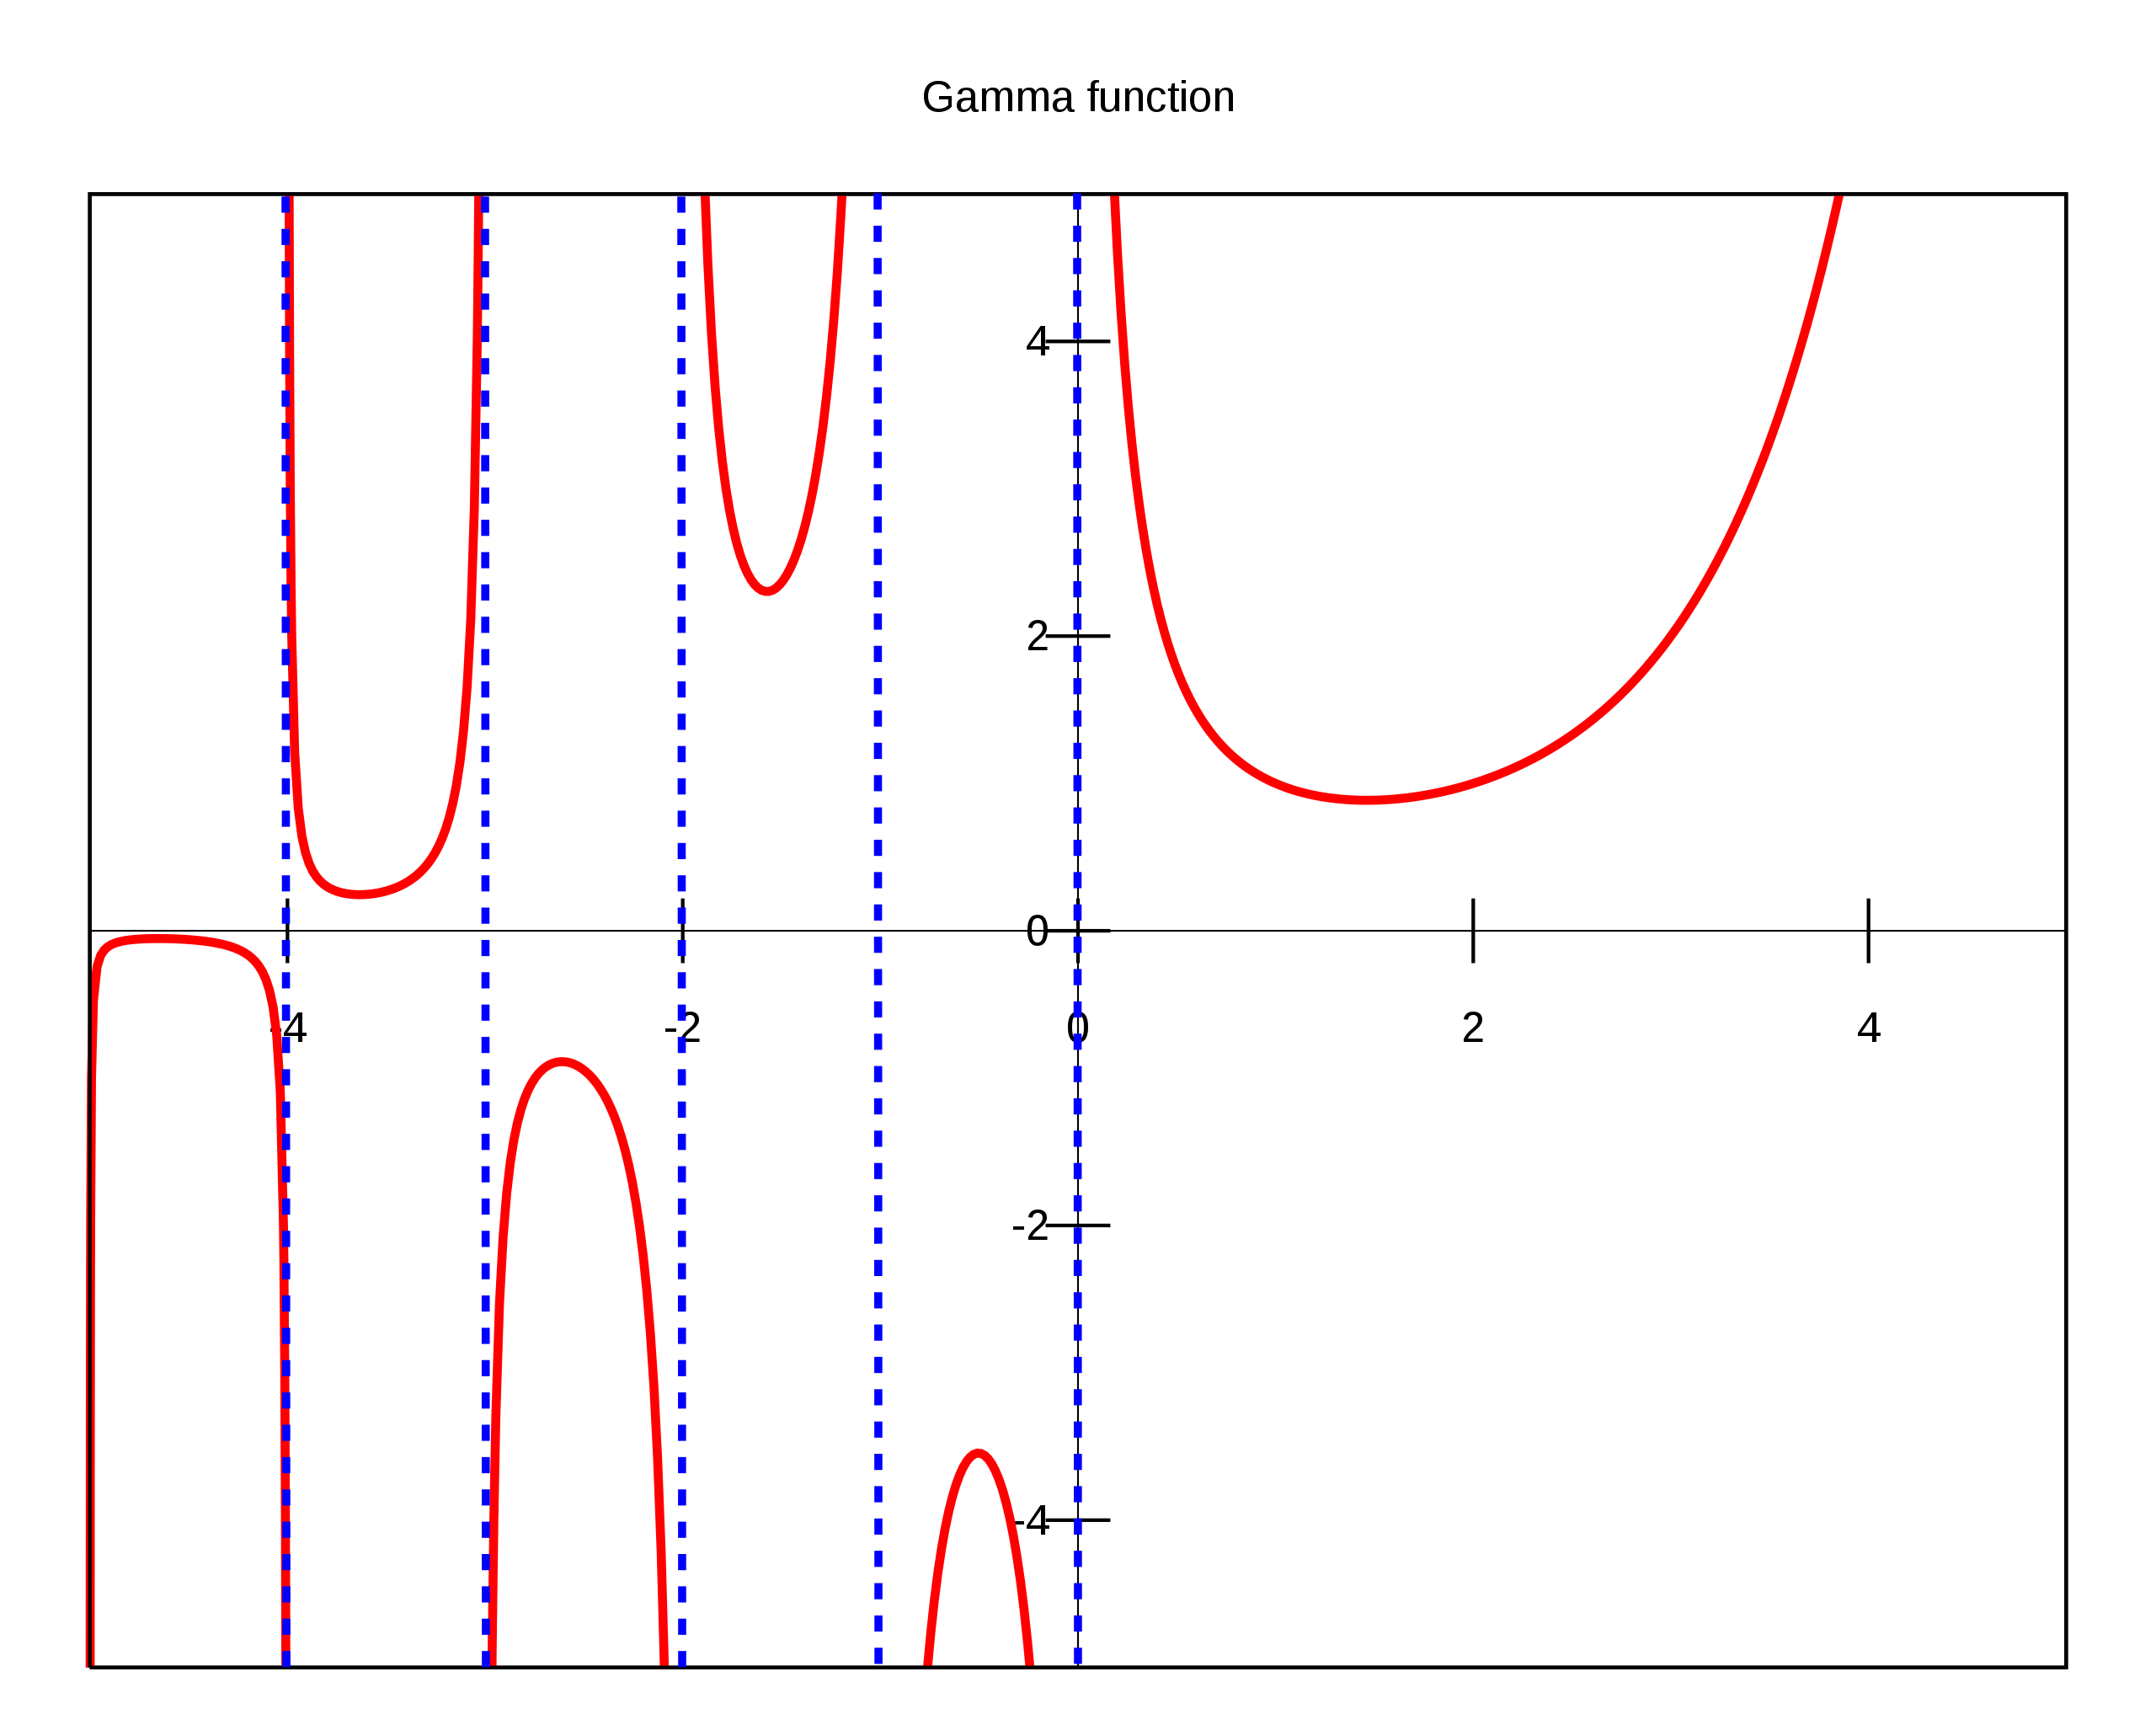
Plot of the Gamma function . The plot was produced running Gnuplot on the following code: set terminal svg set output "Gamma_plot.svg" set title "Gamma function" set xrange [-10:10] set yrange [-10:10] set key off set xzeroaxis linetype -1 linewidth 0.5 set yzeroaxis linetype -1 linewidth 0.5 set xtics axis set ytics axis plot "gamma.dat" using 1:2 with lines linewidth 2 the file "gamma.dat" contains the values of the Gamma function and can be produced with the following Matlab commands (it is meant to work in Octave, too, but it returns an error in version 2.1.64): t = -5:0.01:5; G = [ t; gamma(t) ]; G = G'; save -ascii "gamma.dat" G;it was then post-processed with Sodipodi. |
| ਮਿਤੀ | |
| ਸਰੋਤ | ਆਪਣਾ ਕੰਮ (Original text: own work) |
| ਲਿਖਾਰੀ | Alessio Damato |
| Other versions |
Derivative works of this file: |
| SVG genesis |

ਲਸੰਸ
I, the copyright holder of this work, hereby publish it under the following licenses:

|
ਇਸ ਸਫ਼ੇ ਨੂੰ ਗਨੂ ਲਸੰਸ, ਵਰਜ਼ਨ 1.2 ਜਾਂ ਫਰੀ ਸਾਫਟਵੇਅਰ ਫਾਊਂਡੇਸ਼ਨ ਦੁਆਰਾ ਪ੍ਰਕਾਸ਼ਿਤ ਕੀਤੇ ਨਵੇਂ ਵਰਜ਼ਨ ਤਹਿਤ ਕਾਪੀ ਕਰਨ, ਵੰਡਣ ਜਾਂ/ਅਤੇ ਤਬਦੀਲੀ ਕਰਨ ਦੀ ਖੁੱਲ ਹੈ; ਬਿਨਾ ਕਿਸੇ ਸਥਿਰ ਫਰੰਟ-ਕਵਰ ਜਾਂ ਬੈਕ ਕਵਰ ਲਿਖਤਾਂ ਤੋਂ ਬਿਨਾਂ। ਇਸ ਲਸੰਸ ਦੀ ਇੱਕ ਕਾਪੀ ਇਸ ਗਨੂ ਫਰੀ ਲਸੰਸ ਭਾਗ ਵਿੱਚ ਮੌਜੂਦ ਹੈ। |
| ਇਸ ਫ਼ਾਈਲ ਦਾ ਲਸੰਸ ਕ੍ਰਿਏਟਿਵ ਕਾਮਨਜ਼ ਐਟ੍ਰੀਬਿਊਸ਼ਨ-ਸ਼ੇਅਰ ਅਲਾਈਕ 3.0 ਅਨਪੋਰਟੇਡ ਹੈ। | ||
| ||
| This licensing tag was added to this file as part of the GFDL licensing update. |
This file is licensed under the Creative Commons Attribution-Share Alike 2.5 Generic, 2.0 Generic and 1.0 Generic license.
- ਤੁਹਾਨੂੰ ਖੁੱਲ੍ਹ ਹੈ:
- ਸਾਂਝਾ ਕਰਨ ਲਈ – ਕੰਮ ਦੀ ਨਕਲ, ਵੰਡ ਅਤੇ ਭੇਜਣ ਲਈ
- ਮੁੜ-ਰਲ਼ਾਉਣ ਲਈ – ਕੰਮ ਨੂੰ ਢਾਲਣ ਲਈ
- ਥੱਲੇ ਲਿਖੀਆਂ ਸ਼ਰਤਾਂ ਹੇਠ:
- ਗੁਣਾਂ ਦੀ ਦੱਸ – ਉਚਿਤ ਸਿਹਰਾ ਦੇਵੋ, ਲਸੰਸ ਦੀ ਇੱਕ ਕੜੀ ਪ੍ਰਦਾਨ ਕਰੋ ਅਤੇ ਇਹ ਦਰਸਾਓ ਕੀ ਤਬਦੀਲੀਆਂ ਕੀਤੀਆਂ ਗਈਆਂ ਸਨ। ਤੁਸੀਂ ਇਹ ਕਿਸੇ ਵੀ ਵਾਜਬ ਤਰੀਕੇ ਨਾਲ ਕਰ ਸਕਦੇ ਹੋ, ਪਰ ਇਹ ਤਰੀਕਾ ਅਜਿਹਾ ਨਹੀਂ ਹੋਣਾ ਚਾਹੀਦਾ ਜੋ ਇਹ ਸੁਝਾਅ ਦਿੰਦਾ ਹੈ ਕਿ ਲਸੰਸ ਦੇਣ ਵਾਲਾ ਤੁਹਾਨੂੰ ਜਾਂ ਤੁਹਾਡੀ ਵਰਤੋਂ ਦਾ ਸਮਰਥਨ ਕਰਦਾ ਹੈ।
- ਸ਼ੇਅਰ ਅਲਾਈਕ – ਜੇਕਰ ਤੁਸੀਂ ਸਮੱਗਰੀ ਨੂੰ ਰੀਮਿਕਸ ਕਰਦੇ ਹੋ, ਬਦਲਦੇ ਹੋ ਜਾਂ ਬਣਾਉਂਦੇ ਹੋ, ਤਾਂ ਤੁਹਾਨੂੰ ਆਪਣੇ ਯੋਗਦਾਨਾਂ ਨੂੰ ਅਸਲੀ ਵਾਂਗ ਉਹੀ ਜਾਂ ਮੁਨਾਸਬ ਲਸੰਸ ਦੇ ਅਧੀਨ ਵੰਡਣਾ ਚਾਹੀਦਾ ਹੈ।
ਤੁਸੀਂ ਆਪਣੀ ਮਰਜ਼ੀ ਦਾ ਲਸੰਸ ਚੁਣ ਸਕਦੇ ਹੋ।
ਫ਼ਾਈਲ ਦਾ ਅਤੀਤ
ਤਾਰੀਖ/ਸਮੇਂ ’ਤੇ ਕਲਿੱਕ ਕਰੋ ਤਾਂ ਉਸ ਸਮੇਂ ਦੀ ਫਾਈਲ ਪੇਸ਼ ਹੋ ਜਾਵੇਗੀ।
| ਮਿਤੀ/ਸਮਾਂ | ਨਮੂਨਾ | ਨਾਪ | ਵਰਤੋਂਕਾਰ | ਟਿੱਪਣੀ | |
|---|---|---|---|---|---|
| ਮੌਜੂਦਾ | 17:56, 18 ਮਈ 2024 | | 600 × 480 (13 KB) | wikimediacommons>संजीव कुमार | File uploaded using svgtranslate tool (https://svgtranslate.toolforge.org/). Added translation for hi. |
ਫ਼ਾਈਲ ਦੀ ਵਰਤੋਂ
ਇਹ ਫਾਈਲ ਹੇਠਾਂ ਦਿੱਤਾ ਸਫ਼ਾ ਵਰਤਦਾ ਹੈ: